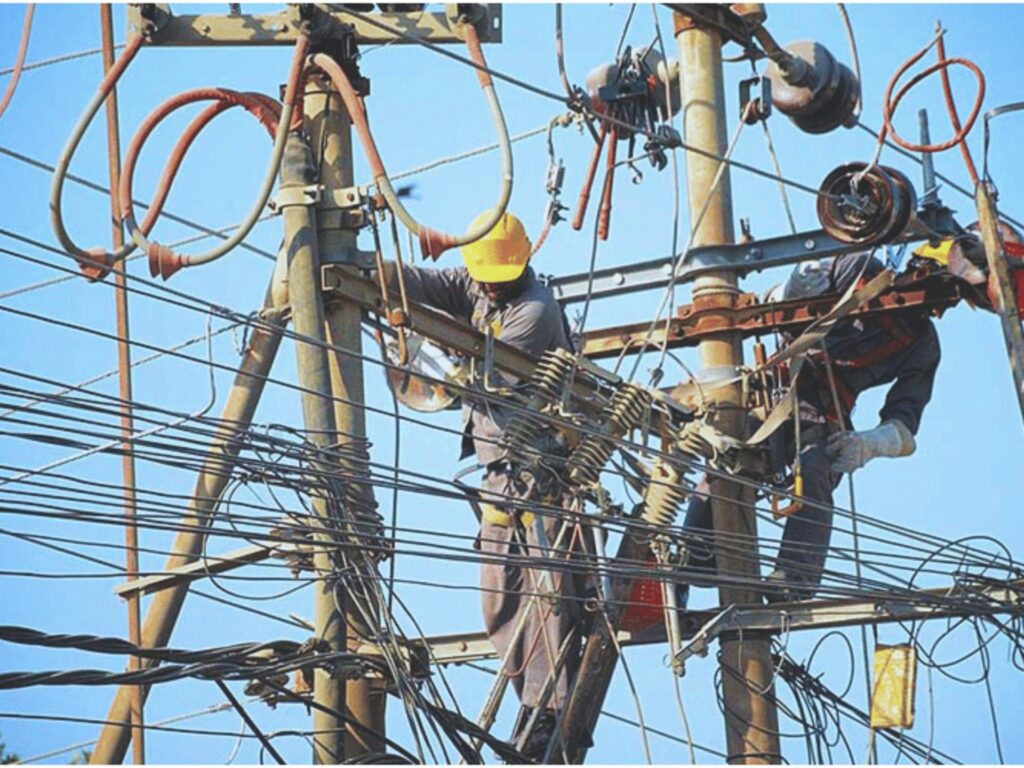
Let’s be blunt, oil and gas doesn’t deal in “low risk.” It deals in pressure. Volatility. Remote terrain. Explosive materials. And when safety slips, the fallout isn’t just a slap on the wrist—it’s sirens, shutdowns, lawsuits, or worse.
Yet… too many companies are still flying blind.
They’re tracking what they think regulators want. Not what actually prevents the next blowout, fire, or fatality.
This post lays out the 15 most critical safety KPIs in the oil and gas industry—and more importantly, how to track and use them to protect your people, your ops, and your bottom line. We’ll also show how modern AI platforms turn scattered site data into a real-time command center.
What Are Safety KPIs in the Oil and Gas Industry?
Safety KPIs—Key Performance Indicators—are measurable signals that show whether your people, processes, and equipment are operating safely.
They track what matters:
- Are we staying compliant?
- Are we preventing incidents—or reacting too late?
- Are hazards getting logged and fixed before someone gets hurt?
But here’s the catch: Not all KPIs are created equal. And in oil & gas? The wrong metrics can give you a false sense of control.
Here you’re dealing with:
- Remote locations where help is hours away
- Live pressure systems that don’t forgive mistakes
- Temporary crews who don’t always know the site—or the risks
So tracking generic stats like “monthly safety training attendance” isn’t enough. You need real-time, field-ready KPIs that give you eyes on the ground—even when you’re hundreds of miles away. The kind that show you where compliance is slipping, where CAPAs are getting ignored, and where the next shutdown risk is hiding.
Think: smart, actionable data. Numbers that spark decisions, not just dashboards that look good in the boardroom.
Related Read: Safety Risk Management in Oil and Gas Industry
Why Safety KPIs Matter in the Oil and Gas Industry
You can’t fix what you don’t measure. And in oil & gas, the cost of guessing isn’t just high—it’s catastrophic. One missed hazard. One ignored inspection. One “I thought someone else handled that”—That’s how million-dollar rigs go offline. That’s how workers end up in the hospital, or worse.
Safety KPIs are your early warning system. Here’s why they matter more in this industry than almost anywhere else:
Regulatory Compliance
OSHA. EPA. IOGP. Local drilling commissions. The alphabet soup of compliance bodies doesn’t care how remote your site is—if your records aren’t tight, you pay.
Miss a log, skip an audit trail, or file late? Fines, shutdowns, and legal hell follow fast. KPIs keep your documentation airtight and your backside covered.
Related Read: Osha Compliance Checklist

Worker Confidence & Culture
When the crew sees hazards getting fixed fast… when near-misses get logged, not ignored…That builds real trust. They speak up more. They look out for each other. They don’t cut corners. And that shift? That’s how safety culture goes from corporate memo to boots-on-the-ground reality.
Incident Prevention
Every explosion has a backstory. Sloppy inspections. Maintenance skipped. Warning signs missed. Leading indicators—like late inspections or unresolved CAPAs—are your clue to what’s coming. Track them right, and you stop small issues before they snowball.
Contractor Accountability
Rotating vendors. Different protocols. Mixed skill levels. If you’re not tracking everyone against the same metrics? You’ve lost control. Safety KPIs give you a unified lens—so whether it’s your crew or a third-party, the standard doesn’t budge.
Downtime & Insurance Costs
Incidents don’t just hurt people. They tank production. Spike premiums. Scare off partners. A solid KPI program reduces accidents, which reduces risk ratings, which lowers costs across the board. It’s not just safety—it’s smart operations.
ESG & Sustainability Pressure
Investors want transparency. Clients want proof. Boards want numbers. “Safety first” isn’t a slogan anymore—it’s a line item in ESG reports. KPIs are how you show you’re serious.
Bottom line: Safety KPIs are how you keep the right people alive, the wrong headlines out of the news, and your operations running like they should.
And that’s exactly why modern AI platforms exist—to digitize the chaos, surface the gaps, and turn your jobsite data into decisions that count.
How to Choose the Right Safety KPIs
What works for a downstream refinery will absolutely flop at a remote drill pad. And chasing vanity metrics like “zero incidents” won’t protect your crew if nobody’s reporting the close calls. So before you plug KPIs into your system, step back and ask: What do we actually need to track?
Let’s break it down:
Upstream vs Midstream vs Downstream
Each sector comes with its own battlefield.
Upstream? You’ve got blowout risks, remote logistics, and extreme conditions. You’ll need to track well control training, BOP inspections, and environmental hazards.
Midstream? Think pipeline integrity, leak detection, and transport safety.
Downstream? You’re watching for chemical exposure, confined spaces, and process safety events.
Bottom line: Your KPIs need to match your terrain—not just your company letterhead.
Regulatory Demands
There’s no shortage of acronyms—and they all want receipts. OSHA. COSHH. EPA. ISO. API RP 75. Each layer of regulation brings its own compliance expectations and reporting criteria. Miss a step? That’s a fine. Miss a trend? That’s a shutdown.
Your KPIs should serve two masters: Your team’s safety reality and your regulator’s audit checklist.
Historical Incidents
Want to know what to track? Start with what went wrong. If the last injury was caused by poor PPE usage, your KPIs better include PPE compliance rates. If a near-miss involved a gas leak, maybe it’s time to track sensor testing frequency and maintenance backlog.
KPIs are reactive and proactive. Don’t just plan forward. Study the scars.
Workforce Size & Mix
Got a tight-knit crew of veterans? Or a rotating door of contractors and third-party vendors? Larger, mixed teams = more complexity, more blind spots, more places for safety standards to break down. KPIs should reflect that reality. Track onboarding rates. Contractor compliance scores. Participation in toolbox talks.
Different workers = different oversight needs. Don’t lump everyone under one blanket.
Digital Maturity
Still filling out checklists with pens? Or halfway in with spreadsheets and texted photos? Be honest about where your tech stands—because a KPI is only as good as the data feeding it. Pick KPIs your current systems can actually support.
Safety Culture Health
Let’s talk about the elephant in the room. You can have perfect “zero incident” numbers and still be totally screwed. Why? Because no one’s reporting what’s actually happening.
If workers don’t trust the system, or think nothing will change, they stop logging near-misses and unsafe conditions. Suddenly, silence looks like safety… until someone ends up in the ER.
Want real insight? Track engagement. Monitor report volume. Reward participation. Measure the health of your culture—not just the absence of injuries.
The KPIs you choose don’t just reflect your safety—they shape it. Choose the right ones, and your system becomes proactive, predictive, and powerful. Choose the wrong ones, and you’re just measuring your own blind spots.
The Top 15 Safety KPIs in Oil & Gas
Look, oil and gas doesn’t give second chances. One missed permit, one unlogged near miss—and suddenly you’re not just writing reports. You’re writing statements to investigators. That’s why these 15 KPIs aren’t fluff. They’re your early warning system. Your operational pulse check. Your silent alarms.
Let’s break them down:
Leading Indicators
These catch the smoke before there’s fire. The best teams track them religiously.
1. Near Miss Reporting Rate
What it is: Tracks how often workers report the “almost” accidents—close calls that could’ve gone sideways.
Why it matters: A high rate = a crew that’s alert and speaking up. A low rate = one of two things: either your site is perfect (unlikely), or everyone’s keeping quiet (dangerous).
Related Read: Near Miss Reporting
2. High-Potential Incidents (HiPos)
What it is: Events that didn’t cause injuries—but absolutely could have.
Why it matters: These are your “ghost incidents.” No one got hurt this time—but the system failed somewhere. Treat them like a live grenade. Disarm now, or regret it later.
Watch trends over time. Repeated HiPos in the same zone = structural weakness.
3. Safety Observation Rate
What it is: Measures how often supervisors or crew perform proactive safety checks or give behavioral feedback.
Why it matters: A high observation rate builds culture. It says: we’re watching, we care, and we act. A low rate? It says, “We’re just waiting for stuff to break.”
4. Permit to Work (PTW) Compliance
What it is: Tracks how often work activities that require a permit (hot work, confined space, etc.) actually follow PTW protocols.
Why it matters: Missing a sign-off isn’t paperwork sloppiness—it’s an open door to fatal errors. PTW compliance tells you if critical controls are actually in place, or just on paper.
Monitor denied permits, late sign-offs, and incomplete checks.
5. Emergency Drill Participation
What it is: Measures the percentage of workers who take part in emergency drills—fire, evacuation, H2S leaks, you name it.
Why it matters: If they don’t practice when it’s safe, don’t expect them to perform under pressure. Low participation = poor preparation = high-risk. Run drills regularly. Mix it up. Test real response.
6. Training Completion Rate
What it is: Tracks if crews are current on mandatory safety training—LOTO, confined space, electrical safety, fall protection, etc.
Why it matters: Expired certs = unqualified hands on dangerous work. And if something goes wrong? Legal exposure skyrockets.
7. Unsafe Condition Reports
What it is: Number of reported hazards—slippery floors, exposed wiring, blocked exits—before they lead to incidents.
Why it matters: This shows how engaged your field teams really are. If nobody’s logging anything, that doesn’t mean everything’s fine. It means no one wants to speak up.
8. Equipment Inspection Completion Rate
What it is: Percentage of scheduled equipment inspections completed on time.
Why it matters: Uninspected = unsafe. From crane cables to gas monitors, missed checks lead to mechanical surprises—and nobody likes a surprise on a rig.
Track inspection timeliness, missed intervals, and overdue equipment instantly.
Lagging Indicators
These track what already went wrong, so it doesn’t happen again.
9. Total Recordable Incident Rate (TRIR)
What it is: The total number of OSHA-recordable incidents per 200,000 hours worked.
Why it matters: This is the KPI every exec, auditor, and insurance carrier watches. It’s the pulse of your safety performance—and a brutal mirror when it spikes.
High TRIR? You’re not just at risk—you’re on fire. Investigate, act, and reduce it fast.
10. Lost Time Injury Frequency Rate (LTIFR)
What it is: Number of injuries that caused workers to miss time, per 1 million hours worked.
Why it matters: This shows not just how often people get hurt—but how badly. It’s the human toll KPI. High LTIFR = serious incidents = serious liabilities.
Compare across crews, contractors, or shifts to see who’s dragging the curve.
Related Read: Lost Time Incident Rate
11. Fatal Accident Rate (FAR)
What it is: Number of worker fatalities per defined hours worked or per 100,000 workers.
Why it matters: This is the number no company wants—but must track. Zero is the only acceptable benchmark. Period.
If this ever rises, it’s time to pause everything and rebuild your safety foundation from the ground up.
12. Days Away, Restricted, or Transferred (DART) Rate
What it is: Measures cases where employees missed work, had restricted duties, or were transferred because of workplace injuries.
Why it matters: It’s a more nuanced take than TRIR—giving you insight into both severity and operational disruption. Rising DART = safety problems are affecting productivity and morale.
Combine this with training data to spot preventable trends.
13. Process Safety Event Rate (Tier 1 & 2)
What it is: Tracks the frequency of process safety events with actual (Tier 1) or potential (Tier 2) catastrophic outcomes—fires, explosions, toxic releases, or major equipment failures.
Why it matters: This is where the real danger lies. Unlike slips or trips, these events threaten lives, assets, the environment, and your license to operate.
Monitoring both Tier 1 and Tier 2 incidents gives you a complete picture of how close you are to the edge—so you can fix cracks before they become craters.
14. Contractor Safety Performance
What it is: Measures safety performance metrics specific to third-party workers—TRIR, training completion, near miss reporting, and compliance rates.
Why it matters: Contractors often face the same hazards—but without the same oversight. And when something goes wrong, your name’s still on the headline.
Tracking this KPI ensures that every crew on your site—whether in-house or hired—plays by the same safety rules and is held to the same standards.
15. Environmental Incident Rate
What it is: Number of reportable spills, leaks, or emissions events per period.
Why it matters: Oil and gas doesn’t just have people risks—it’s got planet risks. Environmental KPIs are tied to permits, fines, and ESG goals—and your reputation with the public.
Track cause, volume, material type, and cleanup time. Don’t let “minor leaks” turn into headlines.
How to Implement Safety KPIs in Oil and Gas Industry
Most KPI rollouts fall flat because they’re buried in spreadsheets, jargon, and resistance from the field. But in oil & gas, with lives, assets, and uptime on the line, your safety KPIs have to be more than theory. They need to live and breathe in the real world. Here’s how to actually roll them out—without pulling your hair out or pissing off your crew.
Step 1: Identify Real Hazards & Clear Goals
Don’t start with the KPIs. Start with what’s actually going wrong (or about to).
Are slips, trips, and falls your biggest issue? Equipment failures? Hot work gone wrong? Blowouts?
Walk the sites. Interview your crews. Dig into past incidents.
Your KPIs should come from the risk—not from a Google list.
Step 2: Map KPIs to the Risks You’re Solving
Every KPI must earn its place. If it doesn’t connect directly to a goal—cut it.
Trying to prevent fires? Track hot work permit compliance, fire drill participation, and equipment inspections.
Struggling with contractor accountability? Monitor TRIR by vendor, training completion rate, and near-miss reporting activity.
No more “vanity metrics.” Only what moves the needle stays.
Step 3: Digitize It
Let’s be blunt—manual logs are where safety insights go to die. Nobody’s got time to fill out forms in the rain, then re-type them in Excel later.
Use an AI platform like Field1st to digitize everything.
- Mobile-first checklists
- Photo and video capture
- Voice notes for those glove-on moments
- Offline mode that syncs the minute you’re back online
This isn’t just faster—it’s how you get clean data you can actually use.
Step 4: Train Crews & Contractors the Smart Way
You want adoption? Make it simple. Make it fast. Make it relevant. Show teams how to spot and report real issues in seconds—not minutes. Run toolbox talks with live examples. Walk through examples in the field, not a classroom.
When they see how it protects them—not just your audit file—they’ll buy in.
Step 5: Review Monthly (Not Yearly)
Annual safety reviews are a joke when you’re working in high-risk zones.
Pull the data monthly. Sort by crew, location, risk type, or severity. Field1st gives you live dashboards so you can see trends as they happen—not after someone’s been airlifted out.
Use those trends to retrain, retool, and get ahead of the curve.
Step 6: Get the C-Suite on Board
If your execs don’t care, no one will.
But here’s what execs do care about:
- Avoiding fines
- Lowering insurance premiums
- Maintaining uptime
- Passing audits without chaos
Show them what Field1st surfaces—risk reductions, compliance trends, and CAPA closeout rates—and tie it straight to dollars saved. When leadership’s in, the whole org follows.
Common Challenges (And How Field1st Fixes Them)
Rolling out safety KPIs sounds great… until you run face-first into the same walls every other EHS manager hits. Here’s what really goes wrong on the ground—and how Field1st bulldozes straight through it.
Underreporting
The Problem: The crew sees a hazard. Shrugs. Keeps walking. Why? Because the last five reports went into a black hole. No fix. No feedback. Waste of time.
The Risk: Unseen risks = untracked patterns = surprise incidents waiting to happen.
Field1st Fix: Reports take 30 seconds. Open the app, snap a photo, speak a note. Done. Everything’s instantly visible to site leads, supervisors, and central safety. And because issues actually get addressed, workers keep reporting. Visibility breeds trust. Trust breeds action.
Fragmented Data
The Problem: Site A uses Excel. Site B has clipboards. Site C texts the safety manager pictures. You’re drowning in formats—and none of it talks to each other.
The Risk: No pattern detection. No big-picture insights. You’re flying blind.
Field1st Fix: Every site logs into one shared platform. Real-time dashboards roll up every observation, inspection, and CAPA across locations. You finally get a single source of truth. No more Frankensteined spreadsheets.
Manual Entry Errors
The Problem: Nobody writes legibly at 5 a.m. in the rain on a drilling rig. Papers get smudged, lost, or never make it back to the office.
The Risk: Data gaps = regulatory gaps = audit nightmares.
Field1st Fix: Digital forms with structured fields, dropdowns, auto-tagging, and even voice-to-text. Every entry is time-stamped, location-tagged, and synced—even when offline. Your reports are clean, consistent, and complete—every time.
Resistance to New Tech
The Problem: “Not another app…” crews think tech = friction. Long logins, glitchy tools, or stuff that only works in Wi-Fi.
The Risk: Low adoption = low data = zero ROI.
Field1st Fix: Designed for the field, literally. Big buttons, offline mode, no signal needed. Glove-friendly. Two-tap inputs. Fast. It’s not tech for the field—it’s tech built by people who’ve worked in it.
No Way to Compare Sites or Teams
The Problem: Which crew reports the most near misses? Which site has the most open CAPAs? No idea. Your data’s flat, isolated, and impossible to benchmark.
The Risk: You can’t fix what you can’t see—or hold anyone accountable.
Field1st Fix: Filter reports by site, team, risk type, severity, and timeframe. See who’s leading, who’s lagging, and where to focus next. It’s like x-ray vision for your safety program.
Why Real-Time Visibility is the New Safety Standard (And Why Field1st Nails It)
In oil and gas, delay is deadly. Hazards don’t wait for your safety manager to get back online. Neither should your data. By the time a paper form makes it to a spreadsheet, the pipe’s already leaked, the scaffold’s already failed, or someone’s already in an ambulance.
You don’t need more data—you need the right data. Instantly. From the field. In context. That’s where real-time visibility separates winners from walking liabilities.
Field1st Delivers Instant Eyes on the Ground
Here’s how:
- Live Site-Level Safety Feeds. Track every observation, inspection, corrective action, and hazard report as it happens. From the control room to the C-suite, you’ll know exactly where the risks are brewing—and who’s on it.
- Mobile-First Reporting (Even Offline). Oil rig in the Gulf. Refinery in Alberta. No signal? No problem. Crews log observations in seconds with Field1st—even offline. Data syncs automatically once back in range. No delays. No data loss.
- Photo, Video & Voice Note Uploads. A blurry description can get someone hurt. A photo or a quick voice note shows the full story—fast. Every report comes with context, evidence, and clarity. The kind you act on.
- AI-Powered Risk Scoring. Not every issue needs red tape. Field1st uses machine learning to triage incoming reports based on severity, history, and impact. High-risk issues get flagged automatically—so your team focuses where it matters.
- Real-Time Dashboards & CAPA Tracking. No more chasing updates or waiting for weekly reports. Instantly see what’s open, what’s overdue, who owns it, and what’s trending. CAPAs don’t just get logged—they get closed.
The Bottom Line?
Reactive safety is outdated. Delayed data is dangerous. Field1st gives you the live visibility to spot threats early, act decisively, and lead with confidence. Because in oil and gas, real-time isn’t a nice-to-have. It’s the difference between control and chaos.
Ready to Actually Use Your Safety KPIs?
Tracking KPIs means jack if you can’t act on them. Most safety programs drown in spreadsheets, outdated logs, and dashboards nobody checks until something already went wrong.
But with Field1st, you don’t just track safety performance—You see it. You sort it. You solve it in real time.
- Your crew logs issues on the spot—photos, voice notes, even offline.
- Your safety team sees the red flags before they explode.
- Your leaders finally get answers without digging through email chains.
Whether you’re running a rig, a refinery, or ten sites across three time zones, Field1st pulls everything together—into one live, mobile-first command center for safety that actually works.
Ready to turn your safety data into action? Book a Field1st demo and take control before the next incident takes control of you.