In high-risk field environments, one overlooked hazard can lead to serious injury, operational downtime, regulatory exposure, and costly corrective action. The scale of the problem is not abstract: the U.S. recorded 4,481 fatal work injuries in 2023, a 3% increase from 4,347 in 2022 — U.S. Bureau of Labor Statistics, April 2025. Many of those incidents stemmed from hazards that were already known but never prioritized for action.
The exposure is highest in the industries that depend most on fieldwork. Construction and extraction occupations alone accounted for 1,117 fatal work injuries in 2023, a 6.6% increase from the year before — U.S. Bureau of Labor Statistics, April 2025. For safety and operations leaders, the challenge is not only identifying hazards but prioritizing them consistently across crews, contractors, and sites. Increasingly, teams pair the matrix with dedicated risk assessment software to keep those scores consistent and current across crews and sites.
That is where a safety risk assessment matrix — also called a safety risk matrix — becomes useful. It gives teams a structured way to score hazards based on likelihood and severity, then use those scores to determine which risks require immediate action. But it is worth stating plainly: a matrix is not a safety program by itself. It is a prioritization tool, and its accuracy is only as good as the field inputs behind it.
This guide explains what a safety risk assessment matrix is, how it works, how to build one, and how Field1st helps organizations connect risk assessments to real-time field intelligence through voice-enabled reporting, photo-based hazard detection, workflows, dashboards, and corrective action tracking.
Key Takeaways
- 5×5 is the most common format in high-risk field operations because its 25 possible risk scores allow for granular escalation protocols, CAPA triggers, and reporting.
- Fatal work injuries rose to 4,481 in 2023, up 3% year over year, and a structured matrix helps teams focus limited resources on the risks most likely to cause serious harm.
- Falls, slips, and trips alone caused 791 fatal work injuries in 2023 — 18% of the U.S. total — the exact category a well-scored matrix is designed to surface and escalate.
- A matrix is only as current as the field information behind it; delayed paperwork, incomplete forms, and spreadsheet workflows make scores outdated.
- Inconsistent scoring across crews is often a bigger problem than whether the matrix is 3×3, 4×4, or 5×5 — calibration and training matter more than grid size.
- The real value begins after scoring, when hazards are connected to owners, deadlines, and verified corrective action closeout.
What is a Safety Risk Assessment Matrix?
A safety risk assessment matrix is a decision-making tool used by safety teams to evaluate and prioritize workplace hazards based on two factors: likelihood of occurrence and severity of impact.
Think of it as a heatmap for risk. By scoring hazards on these two axes, teams can visually categorize threats and determine which require immediate action versus those that can be monitored or tolerated. This mirrors the risk management process described in ISO 31000, where risks are identified, analyzed, evaluated, and treated in a repeatable cycle.
This method standardizes risk evaluation and gives teams a clear, repeatable framework for deciding how to allocate safety resources.
The value of a matrix depends on the quality of the information feeding it. If hazards are captured late, forms are incomplete, or observations are buried in spreadsheets, risk scores can quickly become outdated. Field-first reporting helps safety teams build matrices from more complete, timely, and verifiable field inputs.
How Does a Safety Risk Assessment Matrix Work?
The matrix works by plotting each hazard on a grid based on two questions:
- How likely is this hazard to occur?
- How severe would the impact be if it did?
Each is scored on a numerical scale (commonly 1–5). The combined score — either through multiplication or mapping — determines the risk level.
Qualitative, Quantitative, and Semi-Quantitative Scoring
Before you build a matrix, it helps to understand three scoring approaches:
- Qualitative — uses descriptor labels only (e.g., “unlikely,” “severe”) with no numbers. Fast, but harder to compare consistently across sites.
- Quantitative — uses numerical scores (e.g., 1–5 × 1–5). Easier to rank and trend, and the approach used throughout this guide.
- Semi-quantitative — a hybrid that pairs descriptor labels with numbers, giving teams the readability of words and the comparability of scores.
For high-risk field contexts across utilities and construction, a quantitative or semi-quantitative approach usually produces more consistent prioritization.
Example: 5×5 Risk Matrix

Risk Score Interpretation
This scoring system is the beating heart of every safety risk matrix—giving teams an immediate, visual sense of which threats demand attention.
- 1–4 = Low Risk (Green): Monitor and document — no action needed unless conditions change.
- 5–9 = Moderate Risk (Yellow): Plan mitigation within an appropriate timeframe, prioritize based on available resources, and monitor for changing conditions.
- 10–16 = High Risk (Orange): Act quickly. Needs mitigation and follow-up.
- 17–25 = Critical Risk (Red): Stop work. Implement immediate corrective action. Notify leadership.
Making It Real: Construction Example
Say a scaffold is missing guardrails:
- Likelihood: 4 — Likely because the scaffold is used daily.
- Severity: 5 — Severe because a fall could be fatal.
- Risk score: 20 — Critical risk.
- Recommended action: Stop work, isolate the area, install guardrails, document the corrective action, and verify closeout before work resumes.
Making It Real: Utilities Example
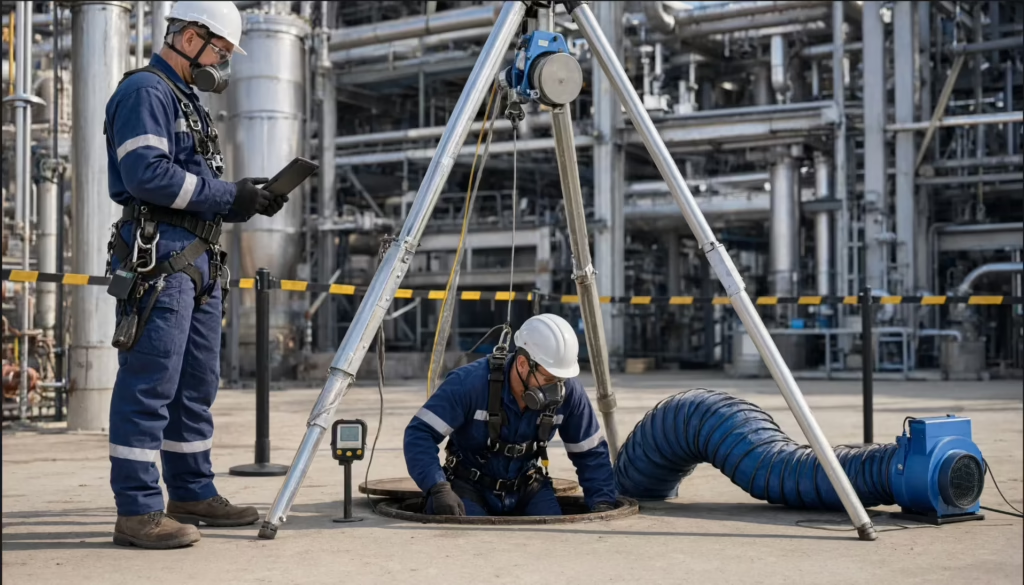
Consider a confined space entry for a below-grade vault inspection with no verified atmospheric monitoring:
- Likelihood: 3 — Moderate, given periodic entries and variable air quality.
- Severity: 5 — Severe, because oxygen deficiency or toxic gas can be fatal.
- Risk score: 15 — High risk.
- Recommended action: Require atmospheric testing, ventilation, an attendant, and a permit before entry; align with NFPA 70E where electrical hazards are present.
Making It Real: Manufacturing Example
Consider a machine with a guarding gap on a rotating drive:
- Likelihood: 4 — Likely, because operators reach near the point of operation on every cycle.
- Severity: 4 — Major, because contact can cause serious crush or amputation injury.
- Risk score: 16 — High risk.
- Recommended action: Install engineering controls (fixed or interlocked guarding), verify lockout/tagout procedures, and retrain operators.
Voice of the field: On r/rstats, one practitioner summed up the core concept cleanly: “One way to look at the risk is the risk matrix where the consequence is on one axis and the likelihood on the other. The red zone represents the highest risk and the green zone represents the lowest risk.” This intuitive, color-coded framing is exactly why matrices communicate priorities so quickly across teams. — r/rstats, 2019
Why a Safety Risk Assessment Matrix Matters
In utilities, construction, infrastructure, and contractor-heavy field operations, safety teams often manage hundreds of changing hazards across crews, sites, and work phases. Without a prioritization system, it is easy to spend time on minor risks while more serious exposures go unaddressed. The matrix solves that by enabling:
- Improved Risk Visibility — Hazards don’t just get logged; they get ranked. Safety teams can instantly spot which threats require urgent action versus those that can be monitored.
- Regulatory Compliance — Many standards, including OSHA, ISO 45001 (clause 6.1 on risk and opportunity planning), and client-specific requirements, require documented risk evaluation. A matrix demonstrates that your process is not only in place but in motion.
- Smarter Decision-Making — Safety and operations leaders can prioritize resources based on consistent risk data, helping teams address high-exposure work before it disrupts people, schedules, or production. This connects site-level scoring to broader governance frameworks such as COSO ERM.
- Stronger Leading Indicators — When hazards, near misses, JSAs, and corrective actions are captured consistently, safety leaders can identify trends before they turn into incidents.
- Clearer Communication — Color-coded risk levels make it easy to explain priorities to everyone on site, from a first-day hire to the project manager signing off on corrective actions.
- Fewer Incidents — By continuously steering focus toward the highest-risk activities, teams fix the biggest problems before they hurt people, halt production, or trigger citations.
The stakes are highest exactly where Field1st’s customers work. Goods-producing industries, including construction and utilities, accounted for 29% of all fatal work injuries in 2023 — U.S. Bureau of Labor Statistics, April 2025 — and the utilities sector alone recorded 125 worker fatalities in 2023, up from 117 the prior year.
With Field1st, the matrix can be connected to real-time field inputs — voice reports, photos, observations, inspections, near misses, and corrective actions — so safety leaders can act on current risk intelligence instead of delayed paperwork.
Types of Safety Risk Assessment Matrices
Not every jobsite has the same risk profile—and the safety matrix you choose should match the complexity of your environment. From small teams doing routine inspections to sprawling operations with dozens of variables, there’s a matrix format that fits the scale. Here are the different types:
3×3 Matrix
Simple, fast, and easy to use.
With just three levels for likelihood and severity, the 3×3 matrix is designed for speed and clarity. It’s perfect for low-risk environments, onboarding sessions, or teams just getting started with formal risk assessments. You won’t get granular detail, but you will get rapid decision-making.
Best For: Warehouses, offices, or training exercises where risks are known and minimal.
4×4 Matrix
Adds more nuance without overwhelming.
The 4×4 matrix strikes a middle ground. It gives safety managers additional layers of judgment—such as “Unlikely” vs. “Possible,” or “Minor” vs. “Moderate” injuries—without slowing the process.
Best For: Construction zones with moderate risk or teams needing more scoring flexibility.
5×5 Matrix
The gold standard for high-risk industries.
With five levels each for likelihood and severity, the 5×5 matrix creates 25 possible risk scores, giving safety teams the power to prioritize with precision. It’s ideal when multiple teams, tasks, or environments are in play—each with different exposures and outcomes. This matrix supports detailed escalation protocols, CAPA triggers, and reporting.
Best For: Energy, manufacturing, heavy civil construction, and complex field operations.
Beyond 5×5
Need surgical-level accuracy? Go deeper.
Some operations—especially those in aerospace, oil and gas, or biotech—use 6×6 or hybrid matrices with weighted scoring or layered categories. These models may integrate financial, environmental, or reputational impact, and are often paired with color-coded bands or heatmaps to guide fast executive decisions.
Best For: Highly regulated or risk-sensitive industries where every detail counts.
By matching the matrix to your risk level, you ensure your assessments are clear, actionable, and aligned with the pace and pressure of your jobsite.
How to Create a Safety Risk Assessment Matrix
A safety risk assessment matrix only works when it is rooted in real conditions — not guesswork or copy-paste checklists. Here’s a six-step process to build a matrix that actually drives safer outcomes on the ground. It aligns closely with the five-step risk process recognized across ISO 31000 and ISO 45001.
1. Identify Hazards
Start with field-level observation. Walk the site, speak with crews and supervisors, and review recent incidents, near misses, inspections, and job hazard analyses (JHA/JSA). Hazards can be visible, such as exposed wiring or missing PPE, or less obvious, such as repetitive motion exposure or heat stress during summer work.
Tip: Field1st helps crews and supervisors capture hazards using mobile photos, voice notes, forms, and location context. Those field inputs create a more complete digital record for review, coaching, compliance, and corrective action tracking.

Spot risks early and log them with Field1st. AI-powered risk prediction
Strengthen hazard identification before you score risk
Accurate scoring depends on complete hazard identification. Explore how job hazard analysis supports more consistent inputs for utilities, construction, and contractor-heavy field work.
2. Define Likelihood & Severity
Create your scoring language and make sure the entire team agrees on what each score means. Consistency is critical.
Likelihood Scale:
- Rare (once every few years)
- Unlikely (could happen annually)
- Moderate (might happen in a few months)
- Likely (probably in the next few weeks)
- Almost Certain (imminent or daily risk)
Severity Scale:
- Insignificant (no injury or minor inconvenience)
- Minor (first-aid case)
- Significant (lost time or medical treatment)
- Major (serious injury or hospitalization)
- Severe (life-threatening or fatal outcome)
These definitions turn judgment calls into consistent assessments, no matter who is scoring.
3. Build the Matrix
Take your scoring ranges and create a grid — 3×3, 4×4, or 5×5 depending on your operational complexity. Color-code the matrix to visualize risk levels quickly (green = low, yellow = moderate, orange = high, red = critical).
You can build it in Excel — many teams do, using conditional formatting to map risk labels to fill colors — but platforms like Field1st offer pre-built templates and digital matrices that are easier to manage, scale, and update across sites.
4. Score Each Hazard
For each identified hazard, assign a likelihood and severity score, then find its place on the matrix. This helps teams see which issues need action now and which can be monitored over time.
Example: A frayed lift cable used daily may score 4 (Likely) × 5 (Severe) = 20 — a top priority.
5. Assign Action Plans & Map to the Hierarchy of Controls
Every risk level should trigger a response — but the type of control should follow the hierarchy of controls, the standard methodology recognized by OSHA and NIOSH for selecting controls in order of effectiveness. Mapping matrix outputs to control levels closes the gap between scoring and mitigation:
| Risk Band | Score | Recommended Control Priority |
|---|---|---|
| Critical (Red) | 17–25 | Elimination or substitution; engineering controls mandatory before work resumes |
| High (Orange) | 10–16 | Engineering controls preferred; strong administrative controls with verification |
| Moderate (Yellow) | 5–9 | Administrative controls, monitoring, and interim measures |
| Low (Green) | 1–4 | PPE and documentation; monitor for change |
Residual risk matters too. Score each hazard twice — once as inherent risk (before controls) and again as residual risk (after controls are applied). Using the scaffold example: inherent risk was 20 (Critical). After installing guardrails and retraining the crew, the residual likelihood might drop to 1, producing a residual score of 5 (Moderate). Documenting both scores is expected for audits and CAPA closure verification.
Field1st lets you automatically assign CAPAs (Corrective and Preventive Actions) based on risk level — with due dates, owners, and real-time alerts if things fall behind.

Automate corrective actions and track progress in real time with Field1st. Request a Demo
6. Review & Update
Sites change. Projects evolve. New subcontractors arrive. Your matrix should be a living document, not a static file. Review it monthly — or after any major incident, project milestone, or crew change. The NIST Risk Management Framework reinforces this same principle of continuous monitoring.
Voice of the field: A preparedness practitioner described the matrix as a live workflow, not a static score: “I use a risk matrix to look at how likely the worst-case scenario is and how severe it would be. Then consider what could be done to reduce severity and what could be done to reduce likelihood. Then record controls and gaps in controls… ensure they are ‘SMART.’ Review periodically.” — r/preppers, 2020
Need a faster way to capture and act on field risk?
Field1st helps safety teams collect voice, photo, and form-based field inputs, prioritize hazards, and track corrective actions in one connected safety operations platform.
Best Practices for Using a Matrix
A safety risk matrix is only as effective as the system behind it. To turn it into a true risk management engine, not just a chart on a wall, follow these proven best practices:
Match the Matrix to Your Risk
Don’t fall into the trap of overengineering. A 3×3 grid might be perfect for smaller, low-risk sites, while a 5×5 or 6×6 matrix offers the precision needed for complex, high-risk operations. Match the matrix size to the reality of your jobsite—not someone else’s template.
Define Risk Criteria Upfront
Ambiguity kills consistency. Set crystal-clear definitions for both likelihood and severity scores before anyone starts logging risks. If “Likely” means once a month to one auditor and once a year to another, your matrix will be flawed from the start.
Involve the Right People
Risk perception is different at every level. Safety managers bring policy knowledge. Field crews bring frontline awareness. Supervisors know the daily grind. Loop in all three when building or reviewing your matrix—because the best data doesn’t come from desks.
Use Both Quantitative & Qualitative Data
A good matrix combines real-world observation with historical context. Use incident logs, near-miss reports, and site walkthroughs. But don’t ignore gut checks from seasoned crews—those instincts often spot what spreadsheets miss.
Score Systematically
To keep scores meaningful, enforce consistency. Use the definitions, don’t wing it. It’s tempting to inflate scores for visibility—but when everything is high risk, nothing gets prioritized.
Prioritize Hard
The matrix isn’t just a risk map—it’s a to-do list in disguise. High scores demand immediate action. Medium risks may need monitoring or interim controls. Low scores should still be logged, but don’t waste resources treating every molehill like a mountain.
Track Your Controls
Listing risks isn’t enough. Every risk scored should be tied to a control—be it elimination, substitution, PPE, or training. Document what you did, who’s responsible, and whether it worked.
Keep It Fresh
Risks evolve with the seasons, work phases, new contractors, or even a last-minute crew change. Reassess your matrix monthly, or at a minimum after every major incident or project milestone.
Make It Visual
Use color-coded risk zones, simple dashboards, or visual boards to make matrix results visible and actionable. If your foreman can’t glance at it and know what matters today, it’s too complex.
Standardize Across Sites
The magic of a good matrix is in repetition. Use standardized templates, train your team on how to use them, and deploy the same system across sites. This creates reliability, auditability, and trust in the data.
Field1st makes all of this frictionless. From mobile access and pre-built templates to real-time dashboards and automated CAPA tracking, Field1st helps safety teams embed these best practices into the daily rhythm of fieldwork—so the matrix becomes a tool they use, not ignore.
When your matrix is built right, used consistently, and backed by smart tech, it stops being just a visual aid—and becomes your first line of defense against serious incidents.
Digitize Your Safety Risk Assessment Matrix Today
Spreadsheets die in inboxes. PDFs get ignored. But a live safety matrix that updates from the field? That’s a game-changer.
With Field1st:
- Snap hazards on-site with voice or photo
- Score risks instantly
- Trigger actions automatically
- Track it all in dashboards
Built for the field. Used by pros. No fluff—just fast, smart safety. Book your free demo.
Safety Risk Assessment Matrix FAQs
What is a safety risk assessment matrix?
A safety risk assessment matrix is a grid that combines the likelihood of a hazard occurring with the severity of its potential consequences to determine an overall risk level. It helps safety teams visualize and prioritize workplace hazards so that the highest-risk issues receive attention and control measures first.
How do you create a safety risk assessment matrix?
To create one, first identify relevant hazards, then define clear scales for likelihood and severity (often 1–5 for each). Build a grid with likelihood on one axis and severity on the other, color-code the risk zones, and finally score each hazard, plot it, and assign actions based on its risk level. Aligning the process to ISO 31000 and ISO 45001 keeps it audit-ready.
What is a 5×5 safety risk matrix?
A 5×5 safety risk matrix uses five categories for likelihood and five for impact, creating 25 cells that represent different combinations of probability and severity. Each hazard is rated on both scales, and its position — often supported by a numerical score — indicates whether the risk is low, moderate, high, or critical and which controls are required.
How do you score likelihood and severity in a safety risk matrix?
Likelihood is scored based on how often an event is expected to occur, using categories such as rare, possible, likely, and almost certain, usually mapped to numbers. Severity is scored according to the worst credible outcome, from minor injury to fatality. The two scores are then combined — commonly by multiplication — to produce a risk rating.
How is a safety risk matrix used to prioritize controls?
Once each hazard has a risk rating, the matrix highlights which risks fall into high, moderate, or low bands, often using red, yellow, and green coding. Teams focus first on red, critical items, applying stronger controls aligned with the hierarchy of controls, while moderate and low risks are mitigated, monitored, or documented according to organizational risk appetite.
What are the limitations of safety risk assessment matrices?
Matrices can oversimplify complex risk situations and rely heavily on subjective judgment when scoring. They may also create false precision if scales are poorly defined. Treat them as screening tools and supplement them with more detailed methods — such as Bowtie analysis and the ALARP principle — for complex or high-consequence hazards.
Ready to turn risk scoring into field action?
A matrix is most useful when it feeds planning, controls, and follow-through. This practical guide shows how to apply risk insights inside a construction safety plan that crews and supervisors can use on site.